There’s a world of difference between truth and facts. Facts can obscure the truth.
Maya Angelou

Could reliable media institutions use facts to mislead or misrepresent reality?
Would a world-class media organization like the New York Times use facts to mislead us?
And if one could, and if the New York Times did, would it be just an error or deliberate misdirection?
Interesting questions, right?
Most media organizations argue that they do not have a bias in their reporting. They are merely calling balls and strikes.
But what if they are not?
What if they do have a bias which shows up in their work regularly, it’s just hard to discern?
If we could illustrate this with a real-life example, that would be extremely helpful, wouldn’t it?
Let’s see if we can get some answers.
Background On Bias
As humans, we are susceptible to many cognitive biases.
For example, we tend to favor those we like and be harsher on those we don’t.
We tend to favor opinions that match ours and discount those that differ.
But those are human characteristics.
They certainly won’t be found in a world-class, unbiased news organization like the New York Times.
There has been so much scrutiny on “fake news” and the quality of honest media reporting recently. One would expect institutions like the New York Times have worked diligently to overcome natural human bias.
One would expect the New York Times to take extraordinary measures to handle data and stories in an unbiased manner and withstand pedestrian scrutiny.
We know that the New York Times is consistently writing unflattering exposes of President Donald Trump. They claim it’s not because they dislike him. It’s not because the Times has any bias against him, but because they think he is incapable, has issues with facts, and they have the proof.
I know, I am gentle with my description above.
I don’t want to use hyperbole or extreme descriptions that a fact-checker will discount as false because the Times did not use those exact words.
I am saying this based on my observations as a casual observer of the public communication between the two parties.
In contrast, the New York Times headquarters is in the great state of New York, where Andrew Cuomo is the Governor.
During the Pandemic, Andrew Cuomo has become somewhat of a cult leader. He has developed a national following for how he was perceived to be managing the crisis in New York.
The Governor and President Donald Trump have a mostly contentious relationship with the occasional moment of bipartisanship.
Conservatives would claim that the New York Times is biased against Donald Trump and protective of Democrats, such as Andrew Cuomo.
It might be instructive to explore how the New York Times recently handled the facts around major controversies faced by these two politicians.
Fact-checking President Donald Trump
Donald Trump’s public statements and speeches have kept media fact-checkers busy since he won the 2016 Presidential Election race.
So it was no surprise that a speech on July 3rd would lead to fact-checking and possibly media headlines and questions. On July 5th, The New York Times published a piece titled – Trump Falsely Claims ’99 Percent’ of Virus Cases Are ‘Totally Harmless.’
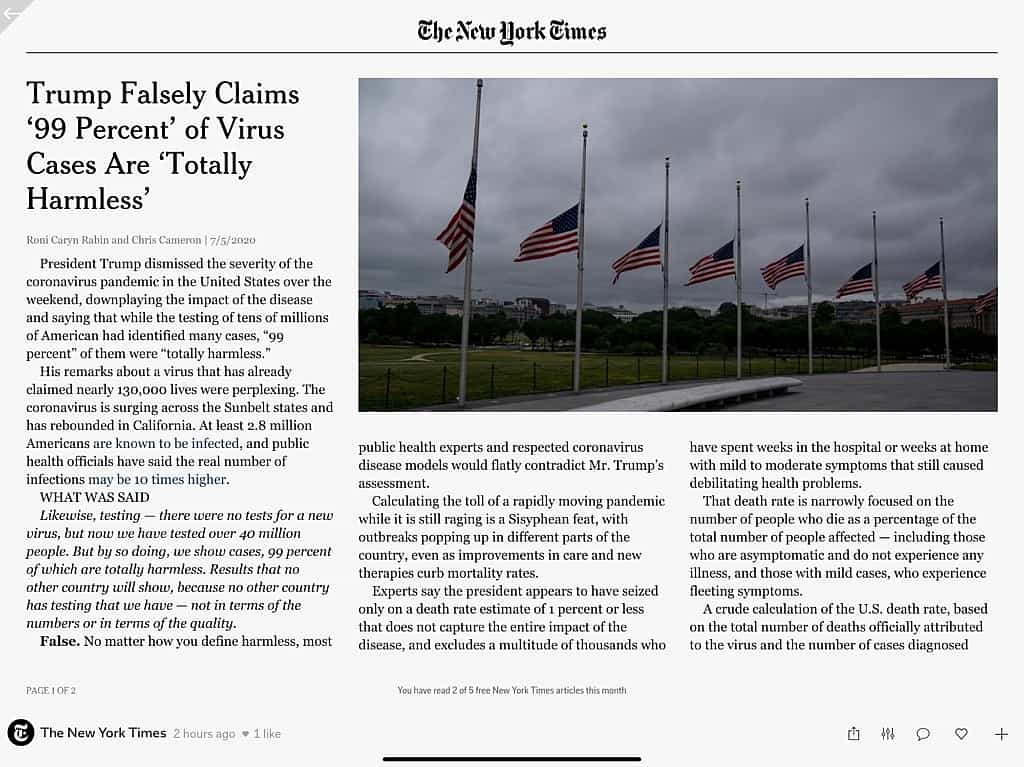
The New York Times says: False: No matter how you define harmless, most public health experts would flatly contradict Mr. Trump’s assessment.
In the article, the New York Times laid out its case for calling this statement false.
Were the statements false?
Would most public health experts flatly contradict Mr. Trump’s assessment?
Clearly, in fact-checking this statement, one would need to make some assumptions about two parts of the statement. The two phrases the New York Times identified in quotes.
- 99 Percent, and
- Totally Harmless
First is a question of precision, and the second a matter of severity.
Firstly, did Donald Trump mean 99 percent precisely, or did he intend something less precise like “The vast majority”?
The New York Times is not clear on what position it takes, but we can test both.
Secondly, did “totally harmless” mean zero harm, or was he referring to “not being fatal”?
Here the New York Times did not seem to care. They went so far as to say, “no matter how you define harmless,” it was false.
So let’s explore their case and logic.
The New York Times says the President’s remarks were perplexing, given at least 2.8 million were already infected. Further, public health officials have said the real number may be ten times higher.
The article points out that “a crude calculation, based on the total number of deaths officially attributed to the virus and the number of cases diagnosed through testing, suggests the mortality rate is higher, with 4.5 percent infected dying”.
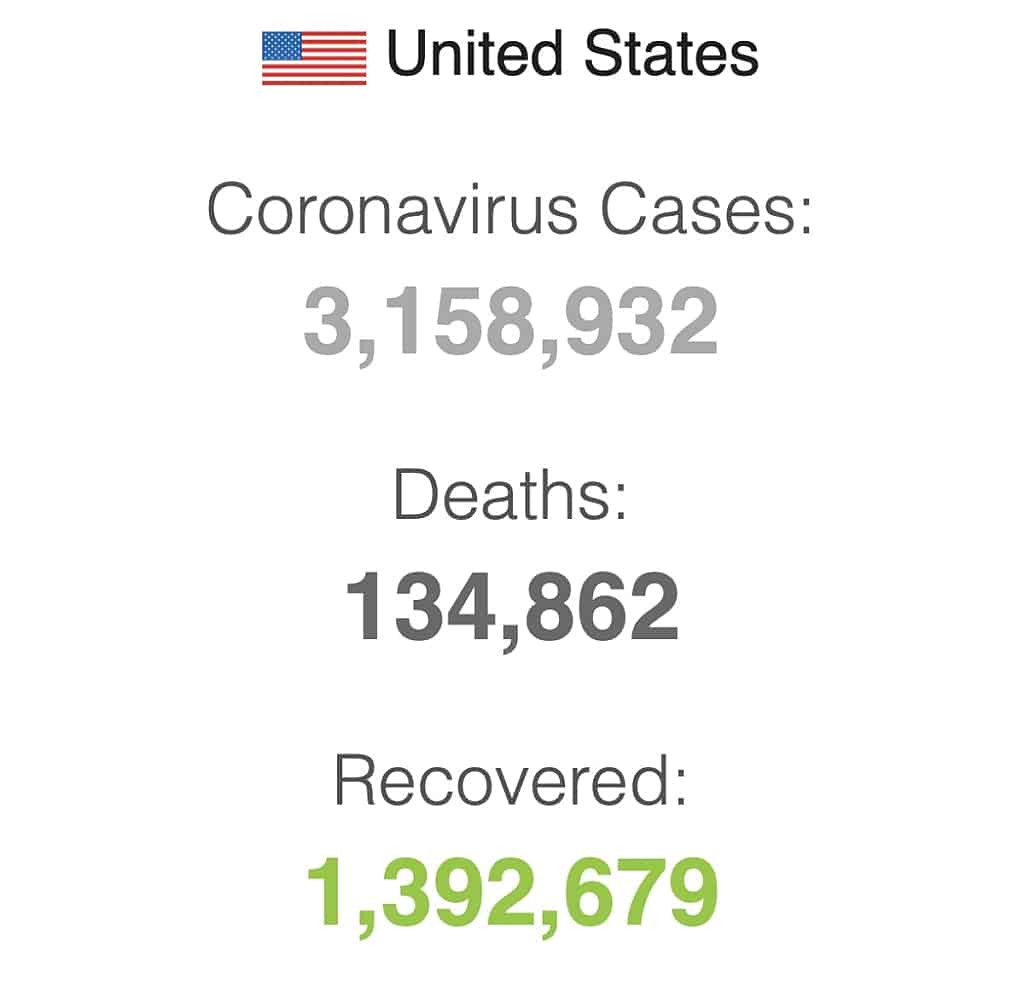
As of this writing on July 8th, confirmed cases stood at 3,158,932 and deaths at 134, 862. That results in a 4.27 percent fatality of confirmed cases. Conversely, that would mean that 95.7 percent were not fatalities. So if we are using 99% in precise terms, this confirmed case fatality rate is not as good as the level Trump stated!
So far, the New York Times is correct in considering the statement false!
Let’s see if that holds up.
The writers acknowledge that experts agree the 4.5 percent fatality rate is very likely inflated. That is because the confirmed cases do not include the many people who may have been infected but not diagnosed.
So the President could be right. That would depend on how many are infected but are not diagnosed.
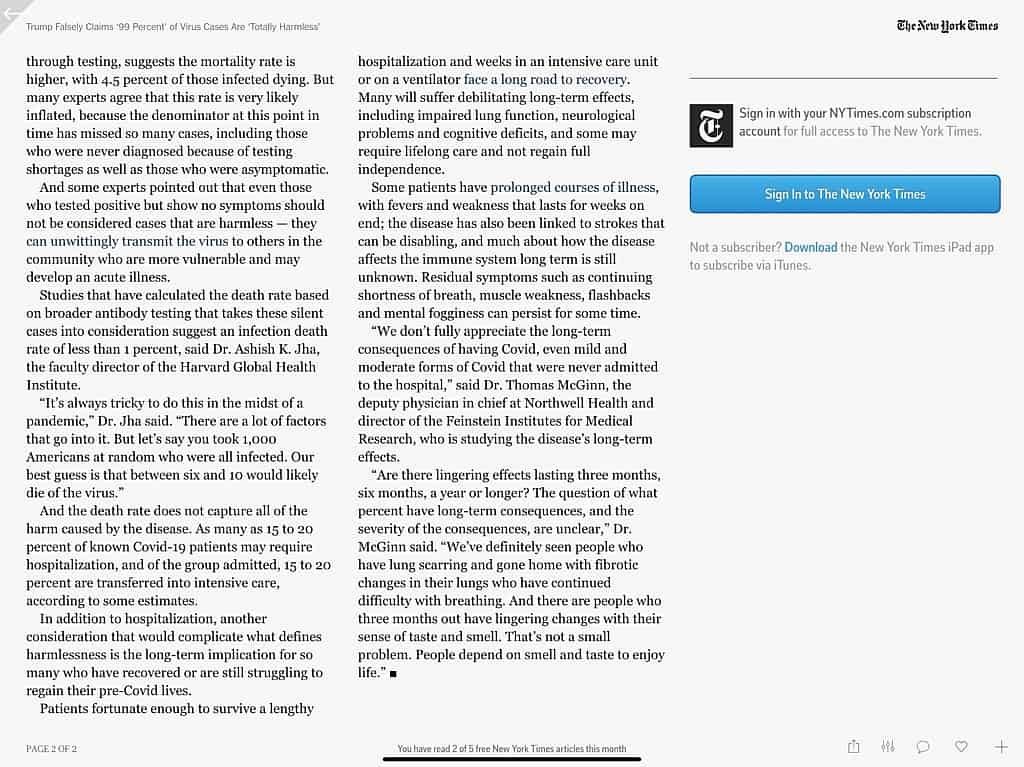
They quote an expert, Dr. Ashish K. Jha, faculty director of The Harvard Global Health Institute. He says, “Studies have calculated the death rate based on broader antibody testing that takes those silent cases into consideration suggest an infection death rate of less than 1 percent.”
Wait.
Read that quote again.
Doesn’t that mean that the President is right?
They further quote Dr. Jha as saying, “There are a lot of factors that go into it. But let’s say you took 1,000 Americans at random who were all infected. Our best guess is that between six and ten would likely die of the virus.”
So their chosen expert says the best guess is that the infection death rate is between 0.6 and one percent. So 99 to 99.4 percent will not be fatalities.
In that case, the President is right.
Further, remember that statement earlier about the Times finding the President’s comments perplexing? That was because Public Health Officials have said the real number of infections might be ten times higher?
Well, if the Public Health Officials are right, then the infection death rate would be ten times lower than the current 4.5 percent, or 0.45%. And 99.55% of cases are not resulting in fatalities.
Again, by the New York Times facts, the President is right.
They spend several paragraphs making a point about fatalities not being the only harm that may come. And they are correct.
But the Times fact-checkers set the standard of precision. And they were pretty clear in their findings that “no matter how you define harmless,” most public health experts and respected coronavirus models would contradict the President’s assessment.
That is not accurate.
If we define harmless as fatalities, then their experts and their own quoted words prove the President is right!
It takes contorted logic to present facts that support the President, in the article, while calling his statement false.
Gullible readers will not take the time to unpack the details, and the headline will be all that’s remembered.
We will never see a headline that says New York Times Falsely Claims That Trump Statements Were False.
Now we know how the New York Times contorts facts with someone they aren’t fond of, let’s see what happens when they like someone.
Fact-Checking Governor Cuomo New York State
In my recently published piece titled “Leadership Lessons from COVID-19 Pandemic,” I discussed the nursing home tragedy.
The New York Times in an article title “Does Cuomo Share Blame for 6,200 Virus Deaths in N.Y. Nursing Homes?“, described it thus:
New York Times
The death toll inside New York’s nursing homes is perhaps one of the most tragic facets of the coronavirus pandemic: More than 6,400 residents have died in the state’s nursing homes and long-term care facilities, representing more than one-tenth of the reported deaths in such facilities across the country.
What went wrong? The effort to answer that question has become politically charged, with Republican lawmakers using the deaths to try to undermine Gov. Andrew M. Cuomo, a third-term Democrat, who has largely been praised for helping New York State to rein in the outbreak.
At issue is a directive that Mr. Cuomo’s administration delivered in late March, effectively ordering nursing homes to accept coronavirus patients from hospitals.
The goal was to free up hospitals’ beds at a time when those facilities were being overwhelmed by fresh waves of virus patients. But family members and nursing home staff feared that sending those patients to nursing homes may have created a dangerous environment that allowed the virus to quickly spread.
Notice how the Times establishes that Gov. Andrew M. Cuomo, a third-term Democrat, has largely been praised for helping New York State to rein in the outbreak. He is a good guy!
How can we get answers to what went wrong with nursing home deaths?
The New York Times suggests that the effort to answer that question has become politically charged, with Republican lawmakers using the deaths to undermine their good guy.
How The Nursing Home Fatality Story Began
The story first broke on Forbes online on May 26th, 2020. The headline: “The Most Important Coronavirus Statistic: 42% Of U.S. Deaths Are From 0.6% Of The Population.”
The article was written by Avik Roy, a Forbes Policy Editor, based on the analysis he conducted with Gregg Girvan for the Foundation for Research on Equal Opportunity (FREOPP.org). Avik is also President of FREOPP, which he describes as a non-partisan think tank that develops policy reform ideas.
A cursory review of Avik’s Twitter feed @Avik suggests that the New York Times will probably find his stance to be towards the right.
The article claimed the 42 percent of all COVID-19 deaths taking place in nursing homes and long term care facilities could be understated. States like New York excluded nursing home residents who died in a hospital, from their nursing home death tallies even if infected in the nursing home.
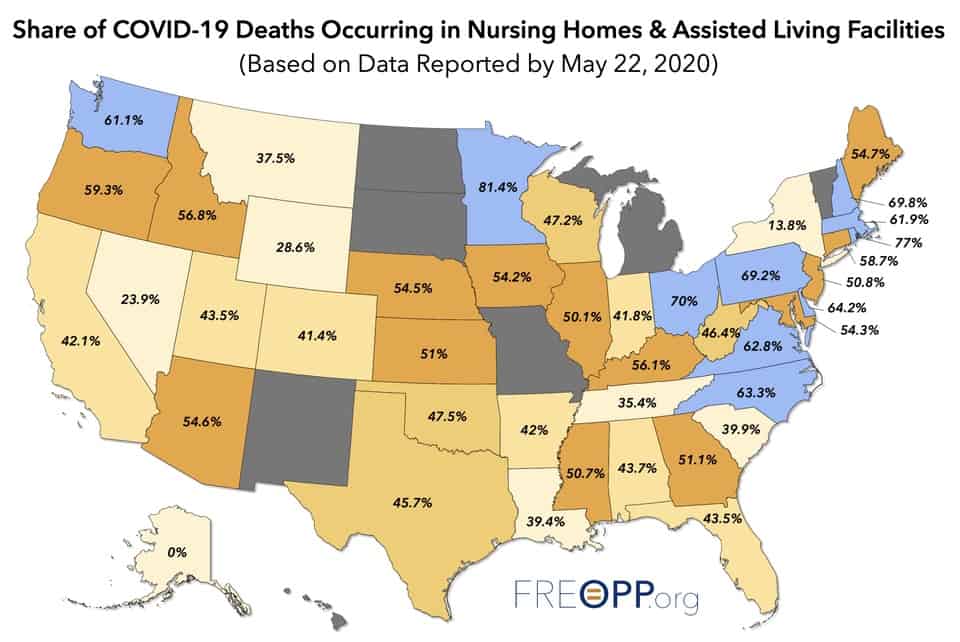
The story included a map identifying each state and the COVID-19 fatalities in nursing homes as a percent of total COVID-19 deaths. New York was at 13.8%, Washington State, with the first USA COVID-19 nursing home fatality, was at 61.1%, Florida at 43.5%.
By that measure, New York would be doing much better than others. No?
After all, New York was well below the National Average at 42 percent.
Yet, the author spent several paragraphs contrasting Florida with New York under the headings: “Why Florida has performed better with vulnerable seniors.” Another section was titled “Learning from Florida’s example.”
Was the author crazy?
The author identifies a problem. 42% of the COVID-19 fatalities occurred in nursing homes. The author shows that metric for each state, and the average reader is likely to compare those numbers from state to state. The problem is that this metric is not a good comparable measure across states.
That’s right, Nursing home COVID-19 fatalities as percent of total state COVID-19 fatalities (the 13.8% for New York), is not comparable across states.
The measure is affected by the proportion of elderly in nursing homes versus outside nursing homes. More important though, the proportion does not provide a relative sense of severity.
Are two states performance similar if they both had 50% of their fatalities in nursing homes when one had 10 fatalities when another had 10,000 fatalities? The answer would depend on how big the state populations were, and particularly the population of elderly who are most at risk.
If we assume that New York at 13.8 percent is better than 42%, then we are wrong. Let’s look at an example. In New York, that 13.8 percent of fatalities in nursing homes represented 255 out of every 10,000 nursing home residents dying. California with 42.1 percent of fatalities in nursing homes represented 73 out of every 10,000 nursing home residents dying. California did a much better job, even though their proportion of fatalities in nursing homes at 42.1% was 3 times higher than New York.
%0 percent of one dollar is not the same as 50 percent of a million. The percent of total is not relevant for comparison in this case.
But the authors had to have a metric by which they rightly figured out Florida was better at it than New York?
And they did. The author compiled COVID-19 fatalities in nursing homes, and they collected the number of residents in those facilities for each state. With that data, they calculated the COVID-19 deaths per 10,000 residents in nursing homes.
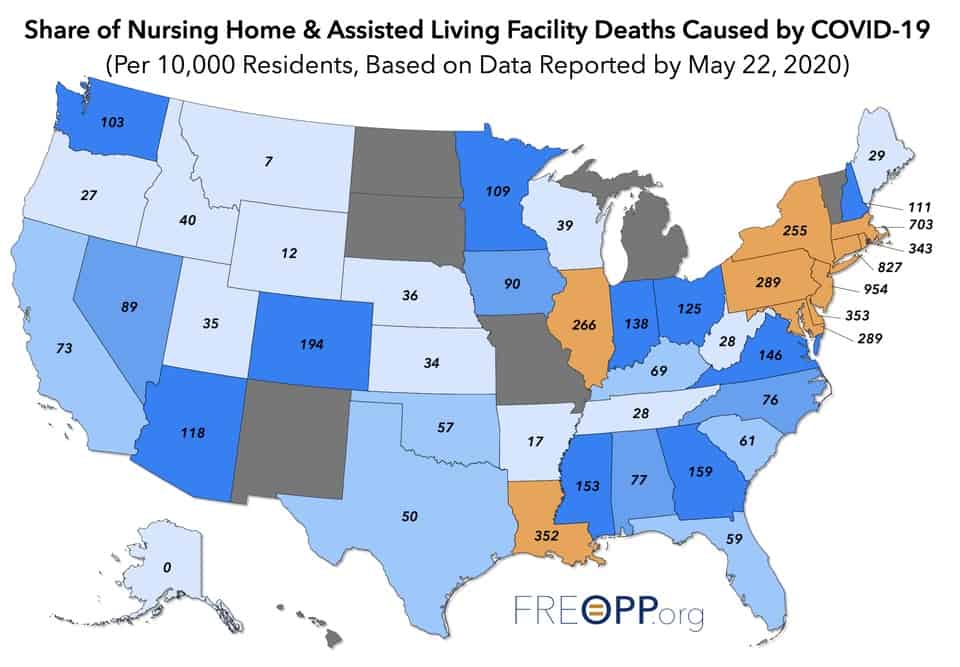
They included a map with that data in the article. On that map, New York is at 255, Washington 103, and Florida 59.
How The New York Times Covered The Story
The story picked up steam on Twitter and among those on the right. For them, it was a story that was not getting attention and was an opening to attack Cuomo.
A month later, on June 26th, the New York Times published its analysis with the following headline.
More Than 40% of U.S. Coronavirus Deaths Are Linked to Nursing Homes.
The NY Times analysis acknowledges concern about the alarming rate of nursing home COVID-19 deaths. The article announced the Times were assembling their database or coronavirus cases and deaths at long term care facilities. “In the absence of comprehensive data from some states and the federal government.”
The New York Times does not disclose if it was working to correct the undercounting issue with its data collection. And the data results from the New York Times versus other public datasets suggest no such improvement.
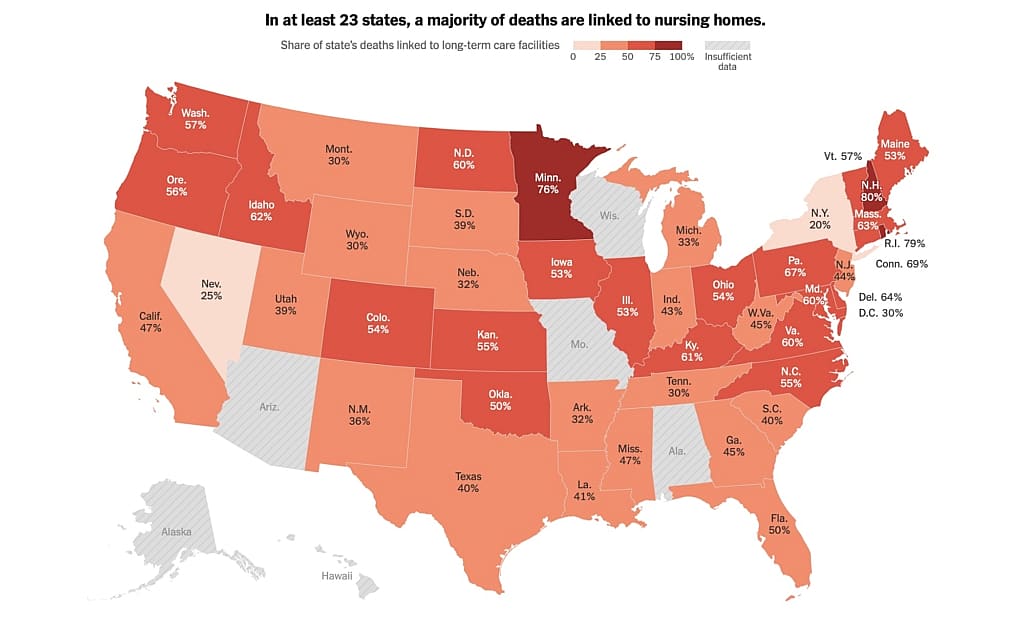
The article includes a map similar to the Forbes map, but with New York Times data. Overall they reach the same conclusion 42% of COVID-19 fatalities occur in nursing homes and long term care fatalities (“over 40 percent”).
The New York Times map is slightly different from the original Forbes map because they have recalculated each state’s rates using their database.
In the New York Times map, New York is now 20%, Washington 57%, and Florida at 50%.
The Forbes data showed New York at 13.8%, Washington 61.1%, and Florida at 43.5%, slightly different. The difference could be from the various sources, or may just reflect the change between May 22nd Forbes data and the June 26th publication by the Times.
The New York Times includes a data table with every state listed. The table details the number of fatalities, COVID-19 cases, deaths (in the facilities), and the share of COVID-19 deaths. That last data metric they include is the same measure used initially in the Forbes article. And the table is sorted from the highest share of COVID-19 deaths to the lowest. It’s their most important fact.
Oe might be inclined to point out that the Times analysis was less favorable to New York, now showing 20% versus the 13.8% earlier.
So why show it?
Because even at 20%, as it was at 13.8%, New York is the lowest state (with data), on that measure. The measure that is not relevant!
To lend credence to an irrelevant metric, they provide additional data, and they sort the states from highest to the lowest performance on this irrelevant metric.
Yes, New York is at the bottom of that list. On a metric that is not useful for comparing states.
Where is the metric that Avik used in the Forbes article to point out Florida was better?
That metric, the one that matters, isn’t in the New York Times analysis piece.
If the New York Times does not have data scientists on staff, they are not credible sources. If they have data scientists that blatantly disregard the most critical analysis, that raises a different question about their position on this story and quality of reporting in general.
Don’t stop reading, though. The story of data misuse does not end there.
How The New York State Defends Itself?
With the Nursing Home Tragedy receiving more attention, the New York State Department of Health (NYSDOH) undertook a study, “In an effort to learn for the future from the data now available.”
The NYSDOH published it’s finding in a 33-page report published on July 6th, 2020 titled “Factors Associated with Nursing Home Infections and Fatalities in New York State During the COVID-19 Global Health Crisis.”
The report is an interesting read with lots of data, some correlations, and several conclusions. You don’t need me to tell you that the report found no relationship between their decision to release COVID-19 patients to nursing homes and the high fatalities in nursing homes.
The logic used in reaching that conclusion might be worth digging into, but that’s not what we will explore now.
The NYSDOH report prominently uses the New York Times article. On page seven, it says the following:
NYSDOH Report
According to an analysis done by the New York Times on June 26, 2020, “at least 54,000 residents and workers have died from the coronavirus at these facilities for older adults in the United States, and as of June 26, the virus has infected more than 282,000 people at some 12,000 facilities.” The same New York Times analysis found that in terms of the percentage of total deaths in nursing homes, New York State ranked 46th in the nation—meaning 45 states had a greater percentage of fatalities (Appendix B).
That’s right. That useless, irrelevant analysis is used in the NYSDOH report to suggest New York is so much better. Why should anyone be looking at New York when its better than 45 other states?
Here is another reference on page 16 to the New York Times analysis:
NYSDOH Report
“… a recent report by the New York Times found that New York’s nursing home fatalities were not disproportionate to the rest of the nation…”
That is not what the New York Times analysis proves.
Appendix B of the NYSDOH report is the entire New York Times data table as if that makes it more relevant.
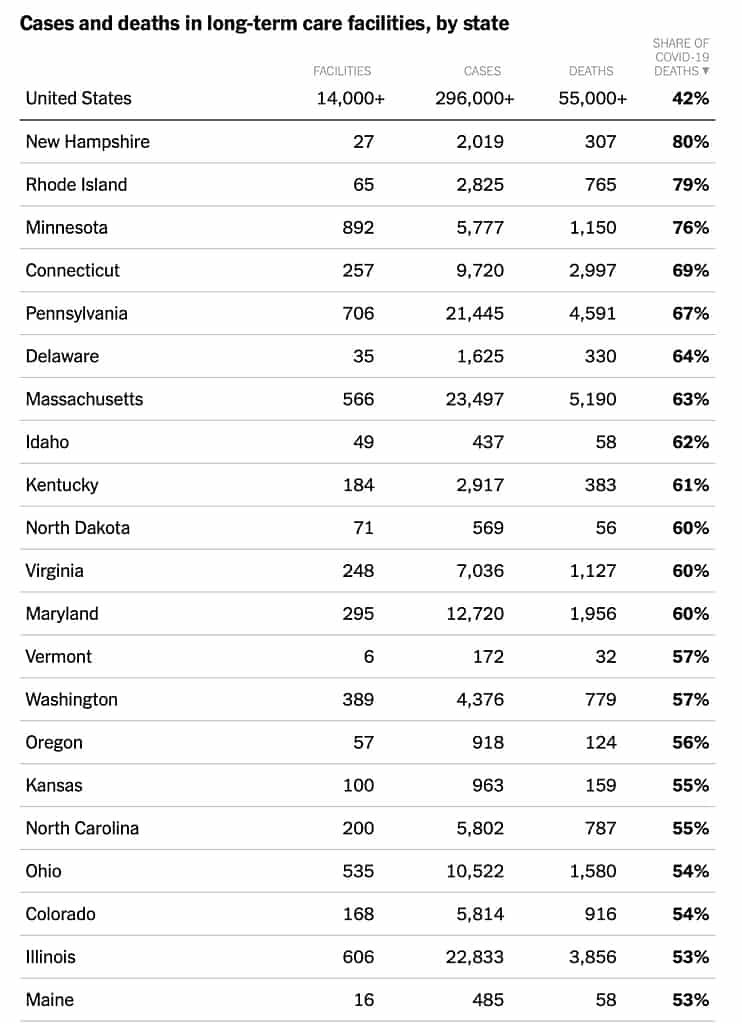
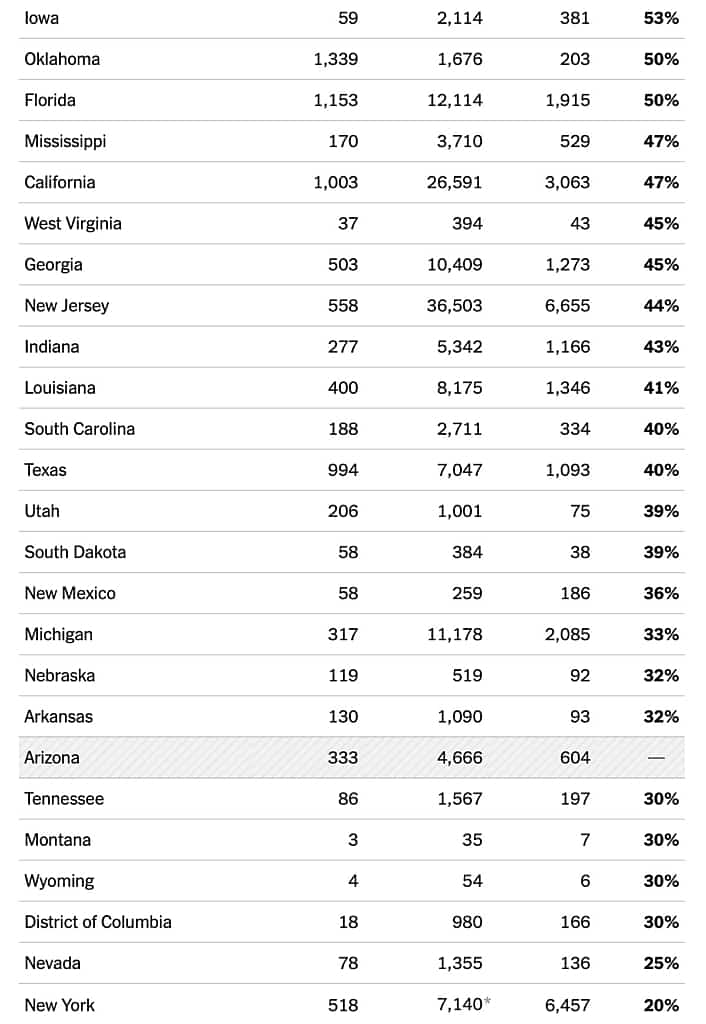
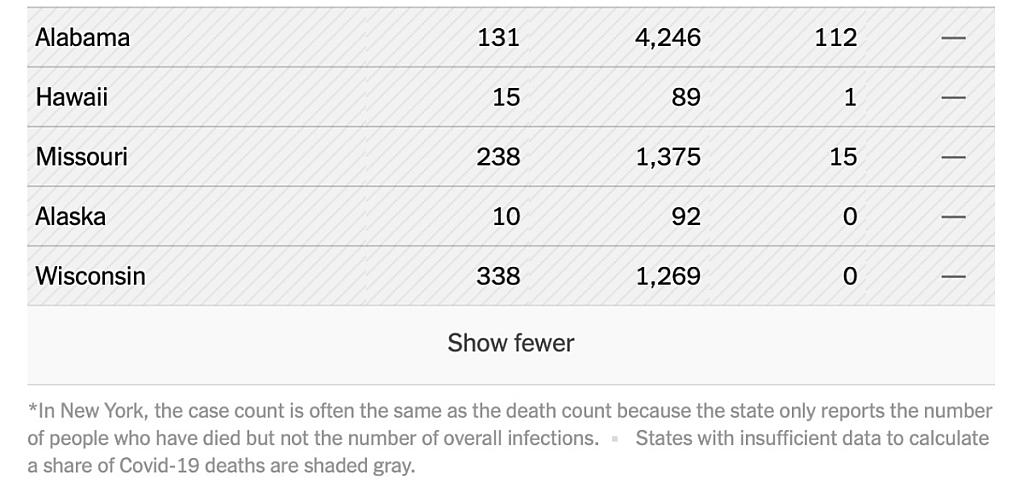
Then in the act of incredible creativity, the NYSDOH data scientists calculate the nursing home deaths related to the state population.
The find:
NYSDOH Report
Looking at this on a per capita basis of nursing home deaths versus total population, Connecticut had 86 nursing home/long term care resident deaths for every 100,000 people, New Jersey 75 for every 100,000, Massachusetts 74 for every 100,000 people, Pennsylvania 35 for every 100,000 people, while New York had 33 for every 100,000 (Appendix C).
By measuring nursing home deaths against the state’s total population, New York’s performance does not look so bad. It looks great, actually—particularly compared to those neighboring states that all followed the same policy.
The analysis would be great if that were a relevant comparison.
There are three problems:
- It’s the wrong metric.
- They compare to the states that followed the same policy, not states that had a different strategy.
- These states collectively show the worst fatality rates of the Pandemic (see discussion on Leadership Lessons from COVID-19 Pandemic).
Just like the earlier metric, this new comparison fails the comparability test.
The elderly are the ones most likely to experience fatalities. So if your state has a high proportion of elderly, they should have a higher per capita nursing home deaths versus the total population.
Curiously, both the New York Times and the NYSDOH ignore the most comparable metric, which they have data to calculate.
When you use the only metric that’s comparable, the per capita nursing home deaths versus nursing home population, you get an unflattering answer.
Remember the Forbes article? It had those numbers. The New York Times and the NYSDOH could have updated or challenged the integrity of those numbers. Instead, they decided to ignore them.
The Forbes chart shows New York with 255 fatalities per 10,000 nursing home residents. That’s 2.55 percent of New York nursing home residents, assuming all counted accurately. The NYSDOH report does not address the undercounting issue at all.
New Jersey is the worst performer. With a whopping 954 or 9.5% nursing home fatality rate, they make everyone look good. Massachusetts at 703 or 7% is among the worst, while Pennsylvania is closer to New York at 289 or 2.9%.
Why include Pennsylvania at 289 and not Connecticut, an actual neighboring state, at 827?
With Pennsylvania results close to New York, it gives a sense that there is a wide range, but New York is still better than the rest. Add Connecticut in and leave out Pennsylvania, and a casual observer might have more curiosity about the gap.
Even more interestingly, why not compare against states that did not follow the same policy? Like Florida at 59, or Washington at 103? Or even California at 73?
Those comparisons would raise uncomfortable questions about the conclusion that New York did an excellent job managing the Pandemic.
Using their chosen irrelevant metric, New York ranked 46th.
How would it rank using the more accurate measure?
New York State ranked as 9th highest in nursing home deaths per 10,000 nursing home residents. Near the top, not at the bottom.
Every good data scientist knows which data is relevant and which is not. Choosing to build a case with irrelevant information is misleading. But the average reader will never know.
So the New York Times analysis of nursing home fatalities in New York provides air cover for the NYSDOH, which features it in their report absolving New York management of the Pandemic. As if to say, move along there’s nothing to see here, this is a political attack.
How The New York Times Cover The NYSDOH Defense?
New York Times
On Monday, the Cuomo administration fired back: The State Department of Health issued a 33-page report meant to dispel the notion that its March directive fueled the spread of the virus.
Curiously, the New York Times covers that New York State had the second-highest number of deaths in nursing homes. Second only to New Jersey. It also acknowledges that the state only counted residents who die in a nursing home, while most other states like California include patients who die in hospitals.
They say that:
New York Times
It is difficult to do state-by-state comparisons about nursing home cases or deaths because reporting requirements vary widely.
That sentence suggests that there are no comparable data or metrics more accurate than the ones they are using.
That is untrue.
Like the NYSDOH report, the Times report:
New York Times
When looking at deaths as a share of the total state population, New York has fewer nursing home deaths per capita than neighboring states like Connecticut, Massachusetts or New Jersey.
That comparison is as flawed as the NYSDOH report using similar language. The Times switched out Pennsylvania for Connecticut, that’s it. No comparisons with states that did not follow the same policy.
Finally, to lend credibility to the NYSDOH report, they included a footnote indicating that the New York State Department of Health Staff was supported by McKinsey & Company. It’s not clear if the support was merely in providing the background, in the analysis, or the entire report. The reference is tagged to the Background section, suggesting it only applies to that section.
The New York Times says: “The report, which was done in collaboration with McKinsey & Company, a consulting firm, said…”
McKinsey and Company is a very credible world-class consulting firm. I had the great pleasure of being schooled there, my first job after graduate school.
Governor Cuomo has mentioned McKinsey in several briefings, but the firm rarely ever discloses that it has worked with or has not worked with any client.
The New York Times knows that!
Do a search for McKinsey on nytimes.com, and you will not find a single flattering article. Mckinsey has rarely ever responded to those attacks, many of which are not grounded in facts.
Why does a footnote that McKinsey supported the NYSDOH make it into the New York Times piece? Are support and collaboration the same thing? What form was that support, or collaboration? And why is it news?
These are questions to which we may never get answers.

So What If The Media Is Misleading With Facts?
This article has not been a scientific review of bias in the media.
If anything, I may be demonstrating my own bias. I may have found a small sample of outrageous biased behavior by one of the most reputed news organizations.
I chose the New York Times precisely because they are a leader.
News cycles are short, fact-checking is hard. And as you can see from above, even fact-checking can be biased or influenced. The news organizations know this. More importantly, they know that there is no accountability for getting it wrong. There are large enough audiences who like to hear facts that support their preconceived notions of reality.
With such egregious misuse of facts in a world-class news organization, what do we expect in those firms with fewer resources or an ideological leaning?
You don’t think Fox News is misleading on their fact checks of Joe Biden? Or in their coverage of Democrat Governors?
Sadly, most are doing it. New is politics, and politics is ideological.
I will leave you with the words of Harry S. Truman, who says it best.
You can never get all the facts from just one newspaper, and unless you have all the facts, you cannot make proper judgments about what is going on.
Harry S. Truman
Types Of Bias Illustrated In These Case Examples
Liking/Loving Bias – The tendency to judge in favor of people and symbols we like. We ignore the faults of other people, products, or companies that we admire.
“We like Andrew Cuomo, we dislike Trump. Andrew Cuomo must be right, and Trump wrong.
Fundamental Attribution Error – we judge others on their personality or fundamental character, but we judge ourselves on the situation. Or, we attribute actions of people we don’t like as character-driven, but the acts of people we love as situation dependent.
“Donald Trump failed in managing the Pandemic because he is incompetent; Andrew Cuomo did the best job he could under the circumstances.”
In-Group favoritism – We favor people who are in our in-group as opposed to those outside our group.
“Andrew Cuomo is a Democrat, so we like Andre Cuomo more than Donald Trump.”
Halo Effect – If you see a person as having a positive trait, that impression will spill over into their other characteristics. (This also works in reverse with negative traits.)
“Andrew Cuomo has done such a good job of standing up to the President, who we dislike, so he must have done a good job managing the Pandemic.”
Naive Realism – We believe that we observe objective reality and that other people are irrational, uninformed, or biased.
“We are the New York Times, if we disagree with you, you must be irrational, uninformed, biased, or lying.”
Anchoring – We rely heavily on the first piece of information introduced when making decisions.
“If New York was number 46 on the list of nursing home fatalities as percent of total COVID-19 fatalities, it must have done a good job.”
Confirmation Bias – We tend to find and remember information that confirms our perceptions.
“New York did not perform poorly. Here are five other states nearby that had similar performance.”
Belief Bias – We judge an argument’s strength, not by how strongly it supports the conclusion but how plausible the conclusion is in our minds.
“We have called Donald Trump a liar before, so he must be lying now.”
Framing Effect – We often draw different conclusions from the same information depending on how it is presented.
“There’s a small difference between New York, New Jersey, and Connecticut, versus a large difference between New York, California, and Florida.”
Authority Bias – We trust and are more often influenced by the opinions of authority figures.
“Dr. Jha said, Our best guess is that between six and ten would likely die of the virus.”
Law of Triviality – We give disproportionate weight to trivial issues, often while avoiding more complex issues.
“Cases are spiking in Florida, versus fatalities in New York are four times those in Italy.”
Clustering Illusion – We find patterns and clusters in random data.
“New York was number 46 on the list of nursing home fatalities as percent of total COVID-19 fatalities.”
Pessimism Bias – We sometimes overestimate the likelihood of adverse outcomes.
“We must keep the south shut.”
Optimism Bias – We are sometimes over-optimistic about good outcomes.
“New York has flattened the curve.”
Blind Spot Bias – We don’t think we have a bias, and we see it in others more than ourselves.
“The New York Times isn’t biased, Fox News is.”
Note: I have used the term “Nursing Home” to include Long Term Care Facilities unless specified otherwise.