Facts are stubborn things; and whatever may be our wishes, our inclinations, or the dictates of our passions, they cannot alter the state of facts and evidence.
John Adams

Imagine a CEO going to an analyst meeting, or the annual shareholders meeting, and talking about inventory performance, but never discussing earnings.
It’s a common technique used by managers to avoid talking about the results that matter when there is a shortfall.
Talk about all the great things you have done, but avoid a critical discussion of your results.
We don’t measure sports teams by the number of shots on goal. We measure them by games won.
Shots on goal is a useful metric to review because it clarifies whether the team is doing the right things to get the right results and wins. But shots on goals is not by any means the most critical measure.
So too, in Coronavirus (COVID-19) terms, we see a lot of discussion about metrics that may contribute to the most critical result but minimal analysis of the crucial metric.
For COVID-19 Management, the essential goal was to minimize fatalities first, and other damages second.
It’s not clear we are near the end in fatalities or damages from COVID-19, but as with all leadership challenges, it’s useful to take an interim review of where we are and performance to date.
That is why we need interim benchmark coronavirus management results!
- The Most Insightful Benchmark Metric of Coronavirus Performance is the fatality rate of those at risk
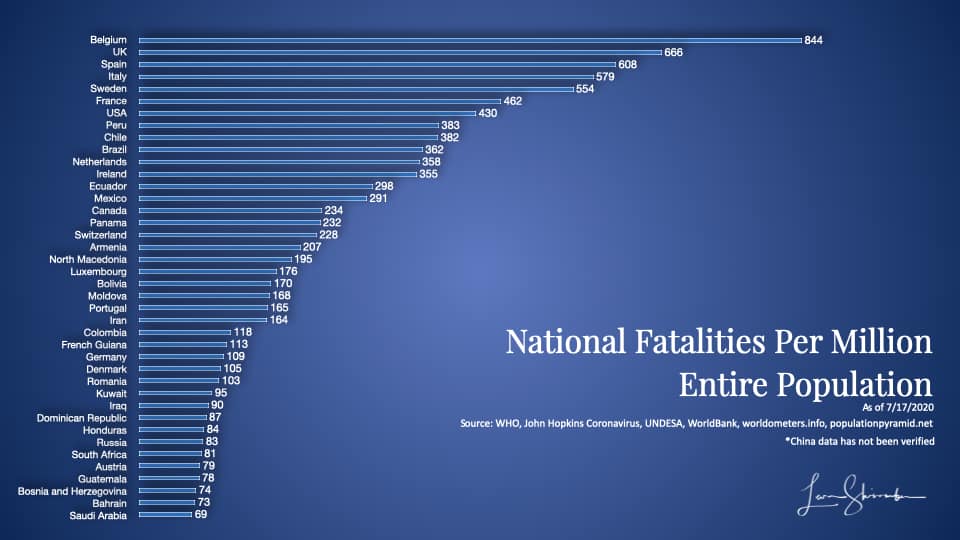
- The USA is among the top 10 Highest COVID-19 Fatality Rates By Country When Measure Against Total Population
- The USA Is Not In The Top 10 Countries For COVID -19 Fatalities When Measured By At-risk Population
- Two States Stand Way Out In USA COVID-19 Fatality Rates
- No Matter Which Population Metric We Use
- New York And New Jersey Are The Top 2 States In COVID-19 Fatalities
- New York and New Jersey Were The Two Most Deadly COVID-19 States For The Elderly
- New York and New Jersey – The Deadliest Locations For COVID-19 In The World, If You Were 65+
- Sources and References
- Data Table Used In Benchmarking Coronavirus Management Results
The Most Insightful Benchmark Metric of Coronavirus Performance is the fatality rate of those at risk
The fatality rate is the best measure of how well leaders have performed in managing to keep the virus away from those at risk. And the most useful version of the fatality rate would be to take the number of fatalities per the population that’s most at risk of being killed by the virus.
Several studies indicate that the fatalities are overwhelmingly occurring among those 65 years and older.
These studies the following percent of COVID-19 fatalities in their population 65 years and older:
| Location | Study Date | COVID-19 Fatalities 65+ |
|---|---|---|
| Belgium | May 22 | 92.8% |
| Canada | May 22 | 95.5% |
| Germany | May 23 | 95.5% |
| Ireland | May 20 | 92.6% |
| Italy | May 20 | 96.4% |
| Netherlands | May 22 | 94.2% |
| Portugal | May 22 | 95.8% |
| Spain | May 22 | 95.3% |
| Sweden | May 22 | 95.5% |
| Switzerland | May 23 | 97.3% |
*Some locations, not listed above, show higher fatality rates among those under 65. In many of those locations, there are some concerns about the exact cause of death. For example, in the USA, a fatality could be counted as COVID-19 if the deceased is positive for coronavirus, despite having died in a car crash or motorcycle accident.
We have two choices:
We can measure COVID-19 fatalities per million population, which includes a large population at extremely low risk.
This metric has the most accurate inputs, that is fatalities and total population estimates. But it underestimates the fatality rate by including the large number of the population that the virus will not kill.
Or, we can measure fatalities per million population, which is primarily at risk. We would have to make a decision about which age group represents those most at risk. I have chosen the 65 and older here based on the significant studies cited.
Ideally, one would have those fatalities for 65 years and over and the population 65 years or older. Both of those numbers are slightly less accurate for each location.
I am using the likely overstated total fatalities. And I am using the best estimates of the population 65 years and older available by location. These inputs are less precise than the first metric, but the result will be reflective of the fatalities among those at risk.
Because of my early years as an actuarial analyst and my Fellow of the Life Management Institute (FLMI), I prefer the measure using 65 years and older (2nd metric). But in the interest of full transparency, provide both in the spreadsheet below.
The USA is among the top 10 Highest COVID-19 Fatality Rates By Country When Measure Against Total Population
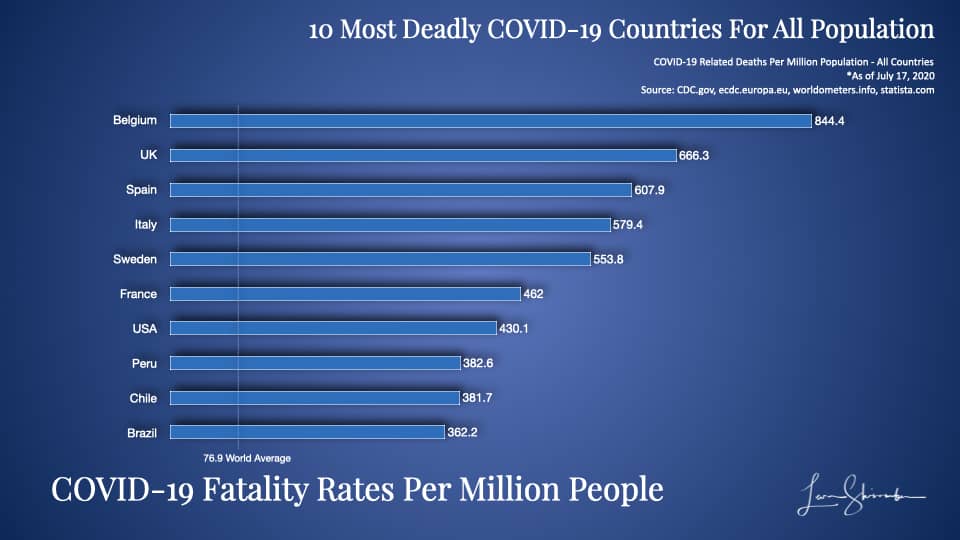
However, since each country has varying proportions of the elderly, we should also look at results based on the at-risk population.
The USA Is Not In The Top 10 Countries For COVID -19 Fatalities When Measured By At-risk Population
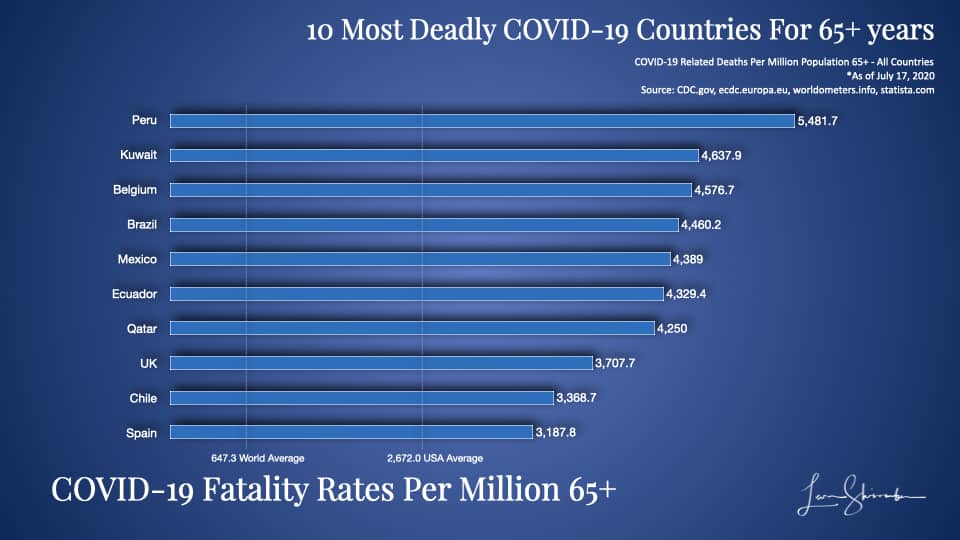
The At-risk population varies significantly across countries. So it’s more relevant to use this number because it measures the fatalities against the most relevant population.
For example, Peru which was number 8 using overall population, has the highest fatality rate when using at-risk population. That is because Peru got all those fatalities from approximately 8 percent of its population. And, when calculating the fatalities on the new lower but more relevant base of population, their fatality rate rises to the top.
Two States Stand Way Out In USA COVID-19 Fatality Rates
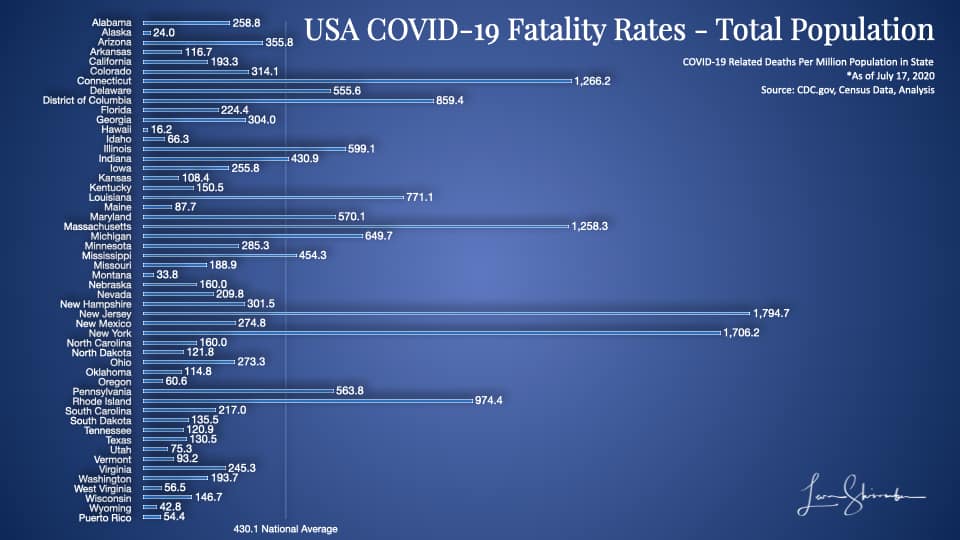
No Matter Which Population Metric We Use
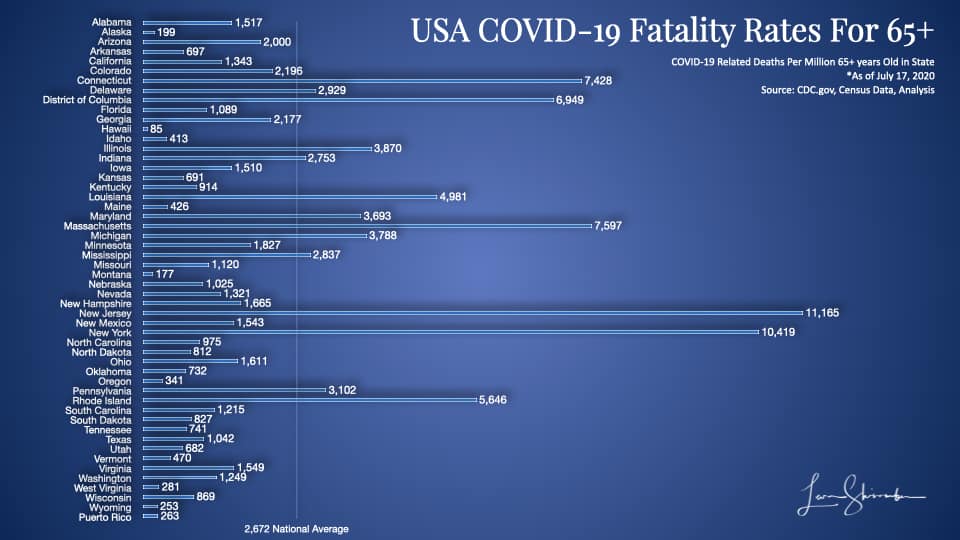
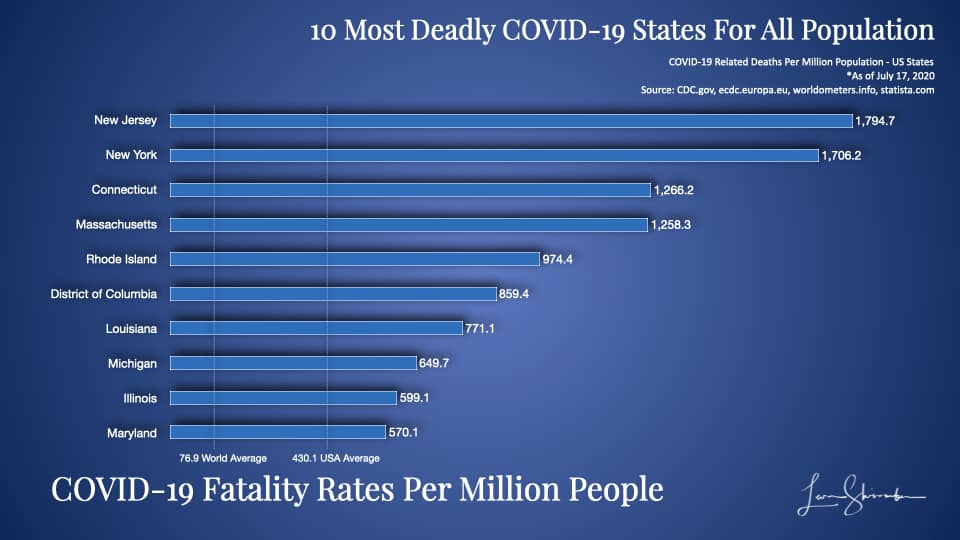
New York And New Jersey Are The Top 2 States In COVID-19 Fatalities
New York and New Jersey Were The Two Most Deadly COVID-19 States For The Elderly
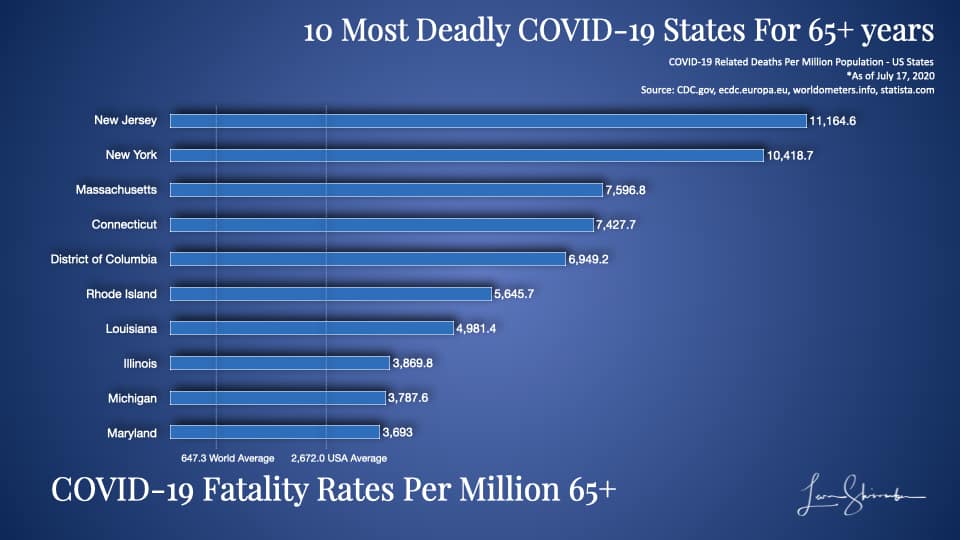
In fact, New York and New Jersey are so bad that they were 4 times higher than the USA Average (which includes their results), or Italy.
New York COVID-19 Fatality Rates are 4 times Italy, or the USA Average! Click To TweetIf we ought to look at individual states as if they were countries and see where they would rank.
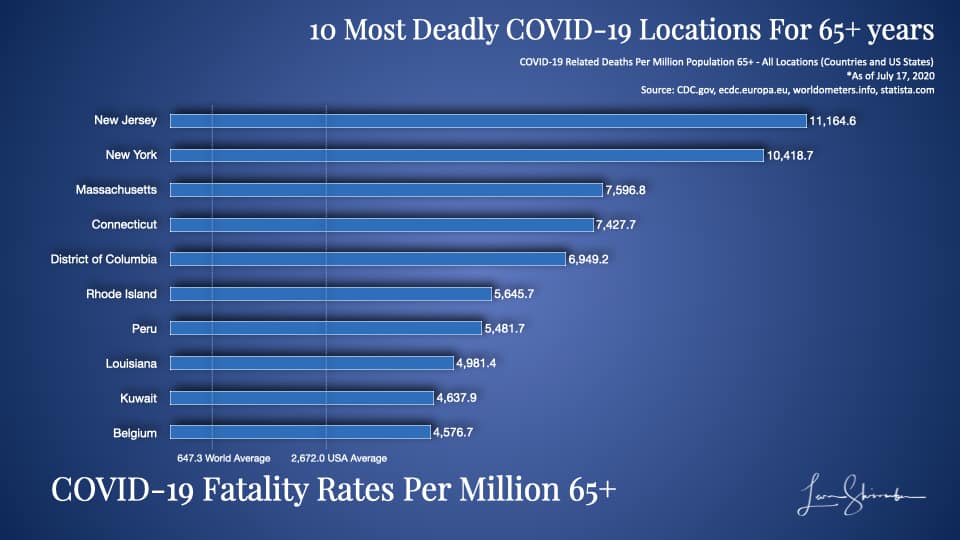
New York and New Jersey – The Deadliest Locations For COVID-19 In The World, If You Were 65+
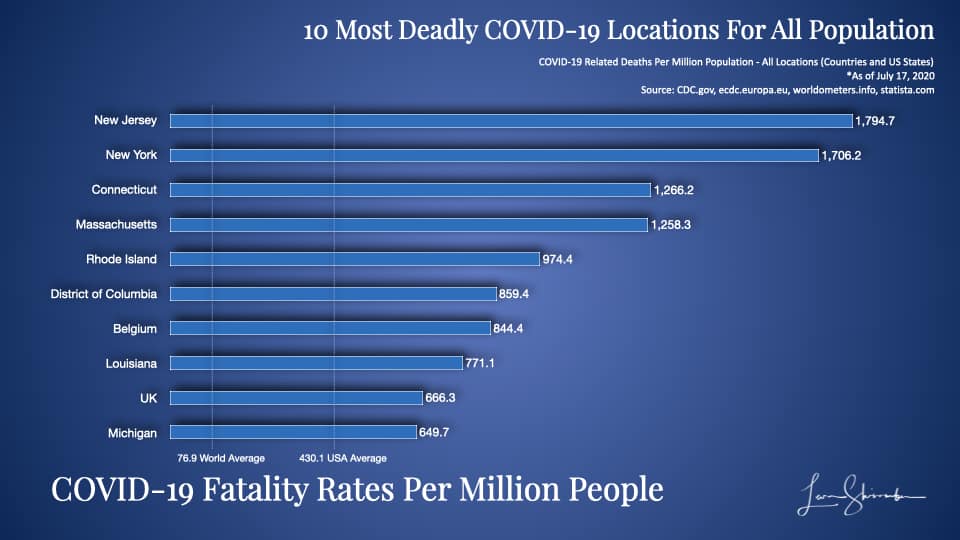
Or Any Age…
Additional Charts
The USA Has The 7th Highest Fatality Rate Among Countries, Using Total Population
The USA Is 17th Highest Country Based on At-Risk Population
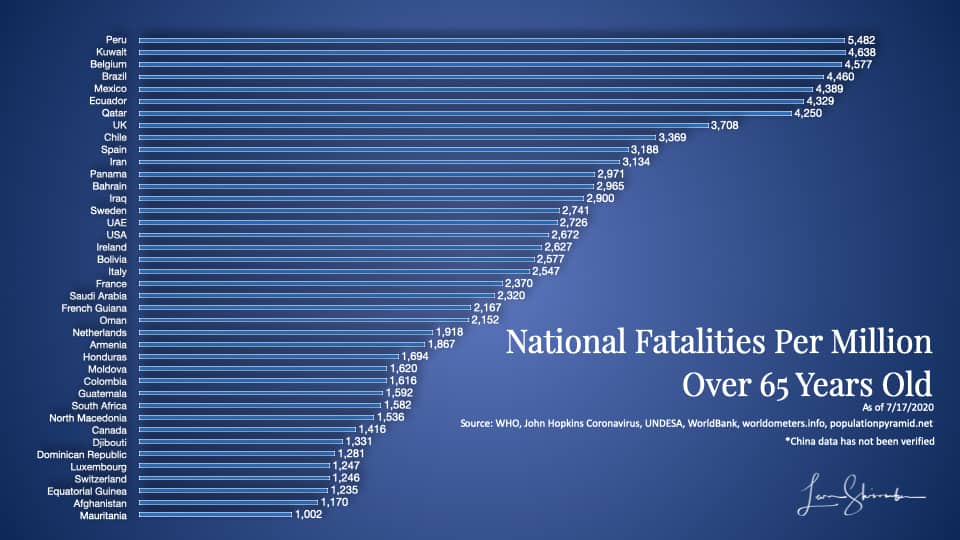
The USA would be 27th were it not for the extremely high fatality rates in New York, New Jersey, Connecticut, Massachusetts, and Pennsylvania.
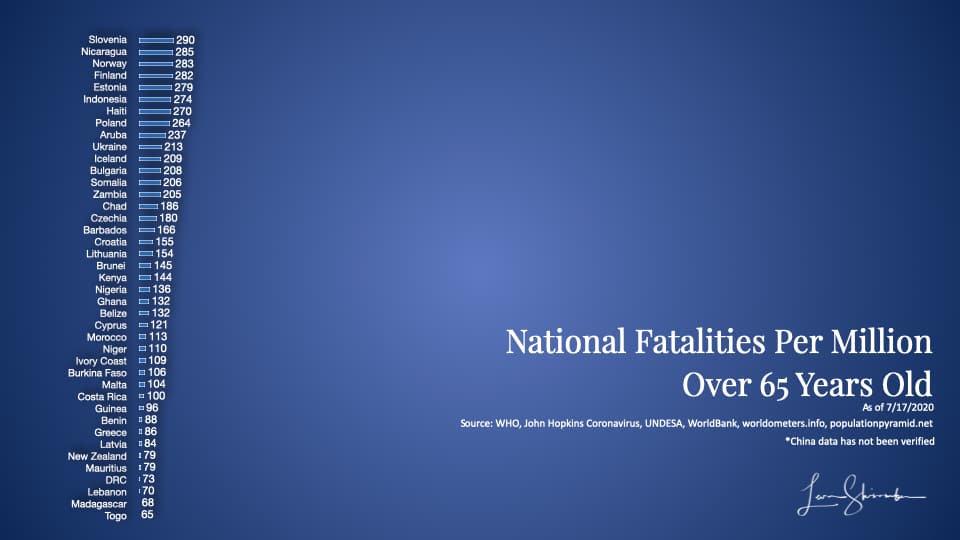
Second Group Of Countries
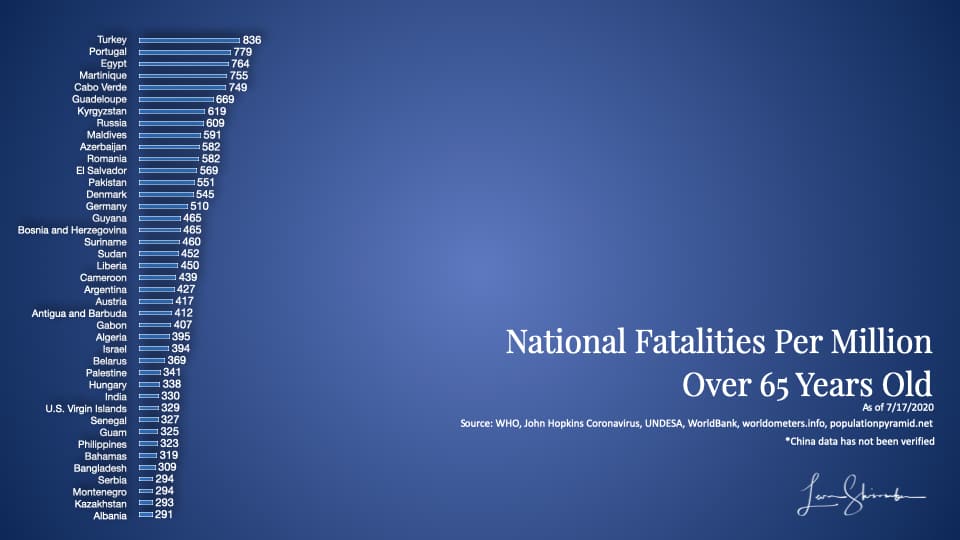
Third Group
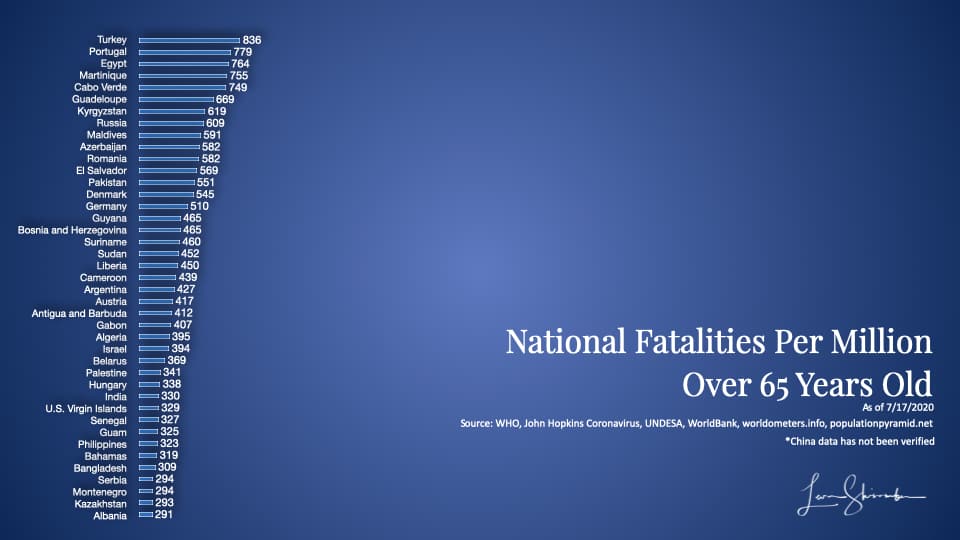
Fourth Group
Sources and References
https://www.sciencedirect.com/science/article/pii/S0013935120307854#tbl1fnb
https://www.ecdc.europa.eu/en/geographical-distribution-2019-ncov-cases
https://www.worldometers.info/coronavirus/#countries
https://www.statista.com/statistics/1103688/coronavirus-covid19-deaths-us-by-state/